Follow the question through the study
Semaglutide side effects: which days enter the evidence?
Read eligibility, follow-up and changing denominators before treating a study timeline as a personal forecast.
Start with the question the record can answer
Post-hoc gastrointestinal analyses pooled STEP-1–3 semaglutide and placebo groups.[1]
A person's experience and an analysis record are different objects. Experience unfolds across time; a record contains selected observations. To interpret an estimate, first specify which question those observations could answer. An average among eligible records, for example, need not describe everything that happened to everyone who began a journey. Its meaning depends on the conditions for entering that average.
Imagine a fictional diary with separate columns for calendar day, a recorded action, an event's beginning and end, and a scheduled measurement. An entry might document an event today, refer to an action several days earlier, and contain no measurement at all. Those columns cannot substitute for one another. Knowing when an entry was written does not establish when the event began; knowing the last action does not supply a missing reading.
Now imagine moving a transparent frame across that invented diary. The frame admits some rows and leaves others outside. Moving it changes the evidence set even if every underlying experience stays exactly the same. An apparent change in a summary could therefore reflect changed observations, changed eligibility, or changed experiences. Separating those possibilities requires retaining the original rows and the rule that selected them.
The useful opening question is consequently precise: which observations remain eligible when the clock moves? Answering it establishes what an analysis can describe before asking whether that description explains an individual course.
Read two clocks without confusing their purpose
Read a bar's length against its labelled axis before interpreting the contrast. Geometry establishes an ordering of lengths; it cannot by itself establish an ordering of benefit, burden or suitability. A measurement label supplies the meaning that the shape lacks. Transferring that shape to another question without its label changes the argument, even though the drawing looks identical.
For a wholly hypothetical exercise, suppose one rule accepts a diary row when a recorded action occurred within the preceding ten days. Another accepts it only within three days. A row with a five-day gap satisfies the first rule and fails the second. The action, row and person have not changed. Only the inclusion test has changed.
That invented look-back rule asks whether the gap is no greater than a specified cutoff. Event duration asks how much time separates an event's beginning and end. The first calculation uses the action and observation dates; the second uses the event's own dates. Neither set of dates can be reconstructed from the other without additional information. An eligible row could describe a new event, a continuing event, or no event under the fictional recording scheme.
Suppose both imaginary rules also require a measurement. A row inside either time window but without that measurement still fails the combined test. Eligibility is then an intersection: the time condition and the availability condition must both hold. A window is therefore neither a duration estimate nor a recommended pause. It also supplies no estimate of how long a medicine remains active. Those questions require different evidence, rather than a different reading of the same bar.
Read the scale before the comparison
Scroll inside the chart to see its full width. With the chart focused, use the left and right arrow keys.
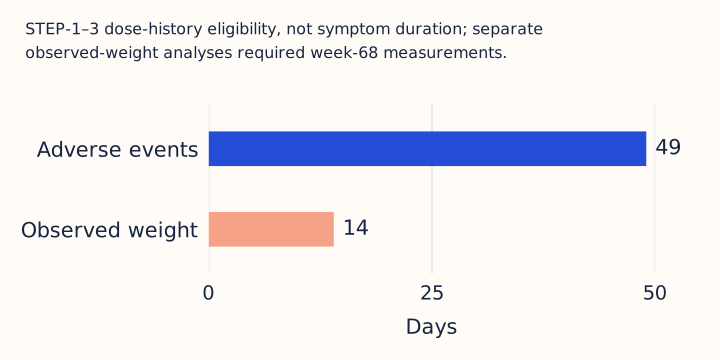
View the chart data
| Analysis | Days |
|---|---|
| Adverse events | 49 |
| Observed weight | 14 |
Separate a scheduled visit from the path to it
Consider two invented series measured in arbitrary units at equally spaced visits. The first reads ten, nine, eight, seven and six. The second reads ten, five, four, five and six. Both begin and end at the same values. Subtracting the initial value from the final value therefore gives the same net change, although the intermediate experiences represented by the series differ.
The steadily falling fictional series never reverses direction. The other falls further and then rises. Adding signed changes between visits reproduces the endpoint subtraction because adjacent values cancel. Adding the magnitudes of those changes instead measures movement along the path and preserves the reversal. These are different operations answering different questions; calling both simply 'change' conceals the distinction.
Even repeated visits leave intervals between them unobserved. In this imaginary example, connecting the points with straight lines is a drawing convention, not an observation of what occurred between visits. More than one continuous path could pass through the same points. A claim about steadiness needs a stated resolution: steadiness across recorded visits is narrower than steadiness at every moment.
An endpoint comparison can establish the recorded net difference without selecting among all compatible histories. A trajectory argument must identify which intermediate features matter and how they were measured. For related reading, the first-month reading guide can help frame a separate timeline discussion; its narrative is not a comparison group for these invented series.
Distinguish a first report from time with an event
Build a fictional log for four people, each observed for ten days. One person records five separate one-day episodes, another records one continuous five-day episode, and two record none. Assume complete daily recording and no overlapping episodes within a person. These are teaching records, with no intended clinical definition of an episode.
There are two people with an event, six episodes and ten person-days with an event across forty observed person-days. Each total is correct. The person count asks who was ever affected; the episode count asks how many separate occurrences were recorded; the person-day count asks how much observed time contained an event. They cannot be exchanged as numerators without changing what the fraction means.
A first-event indicator gives the two fictional people with events the same value. It discards both the recurrence in one record and the uninterrupted stretch in the other. Conversely, the total person-days with an event happens to match between those two records, while the arrangement of that time differs. Equal totals do not establish equal patterns.
To examine recurrence in this invented log, retain episode boundaries rather than only the first marked day. To examine continuity, retain the daily sequence rather than only the episode total. Neither refinement requires deciding that one pattern is clinically worse. It requires specifying the descriptive feature of interest. If the recording scheme did not define when one episode ends and another begins, even the episode total would need an explicit coding rule before it could be reproduced.
Follow eligibility when observations disappear
Imagine six scheduled endpoint records. Four contain changes of minus two, minus four, minus six and minus eight arbitrary units; two contain no measurement. The four observed changes sum to minus twenty, so their mean is minus five. That arithmetic describes the available values. It does not supply values for the two empty cells.
Try two explicitly hypothetical sensitivity scenarios. If both missing changes were zero, the mean across all six records would be minus twenty divided by six. If both were minus ten, it would be minus forty divided by six. The same observed data support either calculation once the assumed missing values are supplied. These scenarios are neither estimated replacements nor credible bounds; they demonstrate the dependence of a broader mean on information not observed.
Eligibility introduces a further distinction. A missing value may belong to someone who remains eligible under a chosen rule, while an available value may belong to someone the rule excludes. A report of four usable records does not identify which process removed the others. A useful accounting therefore separates expected records, observed records and records meeting the analysis conditions.
In this imaginary cohort, learning why the two cells are empty could guide a more defensible analysis, but a reason alone would not reveal their numerical contents. The observed mean cannot identify the missing values or the selection mechanism. A stronger sensitivity exercise would state why particular alternatives deserve examination and show whether the scientific conclusion changes across them, rather than treating one convenient completion as recovered data.
Ask where the timeline begins
A timeline needs an origin as well as a length. Consider an invented example in which person A enters observation on calendar day zero and person B enters on day four. Suppose each reaches a stipulated eligibility milestone three days after entry. On calendar day five, A has reached that milestone and B has not. Calendar time, time since entry and time since the milestone place the same observation differently.
Starting a comparison at the imaginary milestone conditions entry on reaching it. Anyone who never reaches it cannot contribute to that comparison as defined. The question has changed from what happens after initial entry to what happens among those who reach the milestone. This restriction may be appropriate for the intended question, but it cannot silently stand in for the broader one.
Time accounting must follow that choice consistently. If A contributes only observations after the milestone while B contributes earlier observations as well, the comparison mixes different stages of the invented process. Calling both intervals 'follow-up' does not make their starting conditions equivalent. An explicit record of entry, milestone attainment and exit would expose the mismatch.
Before comparing a timeline with a personal narrative, identify what zero means in each. For separate educational reading, see the symptom discussion; it does not validate this fictional example. A clear origin lets a reader distinguish a statement about elapsed time from a statement about who was eligible to be observed.
Distinguish a modeled pathway from a sequence
Modeled GI mediation was below one percentage point of placebo-adjusted weight difference.[1]
Imagine treatment assignment A, an event report B and a later measurement C. A proposed pathway through B requires the relevant event to precede the outcome it is supposed to help explain. Merely arranging those letters chronologically, however, does not establish the pathway. An unmeasured factor could influence both B and C, creating an association even if changing B would not change C.
Feedback creates another possibility in this hypothetical system. An earlier measurement could influence whether a later event is reported, while the later report precedes the final measurement. Labelling the report 'before the endpoint' would conceal the earlier measurement's role. A causal account needs the timing of the relevant variables, not just the date of the final column.
A model can divide a contrast into components attributed to specified pathways under its assumptions. That division differs from an experiment that directly assigns the event B. Random assignment to A, if stipulated in the imagined design, does not also randomize which people experience B. Comparing those people afterward consequently requires additional reasoning about how membership in B arose.
For a separate, invented arithmetic example, let the total contrast be ten arbitrary units and the indirect component one unit. The component is one unit on the measurement scale and ten percent of the total contrast. Those descriptions use different denominators. They are not interchangeable, and neither recalculates the published estimate.
In this fictional exercise, the decomposition becomes informative only after its assumptions and measurement order are specified. A small modeled component would not show that every individual follows the same route. The useful question is which alternative causal arrangements the available observations can distinguish.
Test the denominator behind a rising line
Suppose a hypothetical first-report analysis has twenty eligible records in one interval and ten in the next. Four new events occur in each interval. The counts are equal, but the conditional proportions are four out of twenty and four out of ten: twenty percent and forty percent. Equal counts therefore do not establish equal proportions when the eligible sets differ.
These invented interval proportions cannot simply be added to obtain a proportion for the original group. Their denominators refer to different sets. The accounting would need to identify which records carried forward, which left, and which had already contributed a first event. If two counts represent distinct first events in the same original group, their numerators may be combined, but interpreting the resulting fraction still requires the appropriate original denominator and follow-up coverage.
A cumulative first-event count retains a person after the first qualifying report. A prevalence count at a particular moment instead asks who meets the event condition then. Someone can remain in the former count while no longer appearing in the latter. The two quantities describe different aspects of the imaginary log.
Likewise, a flat first-event curve could coexist with repeated reports among people already counted. Those reports would add nothing to the first-event total. This is a mathematical possibility, not a statement about the observed trials. To interpret a rising or level line, identify the counting rule before assigning a meaning to its slope.
Design a check that could change the interpretation
Novo Nordisk funded trials and writing.[1]
A disclosure should prompt a question that evidence could answer. Funding alone cannot establish whether a calculation is correct, nor can transparency substitute for checking it. An independent reproduction would need enough detail to reconstruct the eligible records, measurement definitions and computational steps. Agreement would establish reproducibility of that calculation; it would not automatically establish that the chosen question is the most useful one.
Consider a proposed reanalysis of an imaginary diary. Before inspecting results, specify two inclusion rules, the quantities to summarize and how missing observations will be represented. Preserve both resulting record sets. Then examine the rows included by only one rule: their dates, available measurements and place in each person's sequence. This identifies where a difference between summaries originates without presuming that either rule is wrong.
Next, keep first occurrence, recurrence and time with an event separate. Compare endpoint summaries with summaries that retain intermediate observations. If those summaries disagree in the fictional exercise, trace whether the disagreement arises from the eligible population, the measurement or the operation used to combine values. A changed headline alone would not reveal which explanation applies.
For related reading, the companion interval analysis develops a related reading problem concerning unequal reporting intervals. Here, the proposed check would be informative if it could change the interpretation under a stated alternative rule. No reproduction or access to individual records is claimed. The proposal specifies what would need to be available for another analyst to challenge the reasoning.
Keep the analytical clock outside treatment decisions
Wegovy is not recommended in severe gastroparesis; gastrointestinal reactions can be severe.[2]
Prior serious hypersensitivity to semaglutide or its excipients contraindicates Wegovy.[2]
These are selected label statements, not a complete safety guide. This article explains how to read an analysis; it does not provide a treatment plan. Turn to the molecule reference as a separate place to examine the publication's reference material and its stated limits.
A rule that admits a record is not a rule that authorizes an action. Moving an analytical boundary can change a calculation without establishing what someone should do on either side of that boundary. The fictional gaps and milestones above therefore provide no waiting schedule, dose instruction or personal forecast.
Keep the questions separate when discussing evidence: what was counted, what the calculation describes, and what information a personal decision would require. The first two can be examined through the record's structure; the third is not answered by the geometry of a timeline.
Putting the evidence together
A convincing account of change needs more than a final contrast. It needs a chain from the question to the eligible records, from those records to the chosen quantity, and from that quantity to the interpretation. Each link can be examined separately. In the fictional examples, identical endpoints leave path shape unresolved, identical event totals conceal different arrangements, and identical observed means permit different completions of missing records. Those are identifiable limits of the information, rather than reasons to abandon analysis. The most informative next observation is one that separates competing explanations: a dated intermediate reading, a retained episode boundary, or clarification of why a record is absent. A proposed reanalysis should state in advance which distinction that observation would resolve. Evidence becomes more useful when a conclusion says exactly what would change it and which uncertainty would remain.
Questions and answers
Can a look-back window tell me how long an event lasts?
No. In the fictional diary, a look-back test compares an observation date with an earlier recorded action. Duration compares the event's beginning with its end. A row can satisfy the first calculation while lacking either date needed for the second. Eligibility therefore cannot recover the missing duration.
Why can two analyses admit different records from the same person?
In the invented log, one analysis might require both a recent action and a recorded measurement, while another uses a different time condition. A person can contribute a qualifying row to one set and no qualifying row to the other. The difference concerns the rules applied to records, not a contradiction in that person's history.
What would make a trajectory claim stronger than an endpoint comparison?
Repeated measurements at stated times would distinguish more possible paths, particularly if the record also preserved relevant exposure states and explained how gaps were handled. A trajectory claim would then specify which feature it estimates, such as reversal or continuity. More observations constrain compatible histories; they do not guarantee an individual prediction.
Scope and limits
The numerical exercises are fictional demonstrations, not estimates for study participants or forecasts for readers. The interpretation depends on the question, recording rules and assumptions stated with each example. Selected source statements do not constitute a complete evidence review or individualized medical guidance. This article makes no claim of clinical review.
Sources to open
- Wharton (2022) — Wiley; checked
- WEGOVY — NLM; checked