Follow the question through the study
Tirzepatide symptoms and weight change: reading between reports
Examine grouping, interval width and missing observations before interpreting a pattern across time.
Begin with the space between two reports
An observation log does not automatically describe the order in which a person's experience unfolded. Imagine a fictional diary submitted at irregular times. An entry received late in the week describes something that began earlier; another entry records an experience immediately. Sorting those entries by submission date gives a history of reporting. Sorting them by the stated beginning gives a proposed history of events. Both arrangements can be accurate descriptions of the same file, yet they answer different questions.
In this invented example, an analyst also assigns each entry to a reporting interval. A late submission might move into a later interval even though its stated onset has not changed. An apparent cluster can therefore arise from the combination of event times, submission times and the rule for placing records. To distinguish these possibilities, retain both dates instead of replacing them with a single interval label. If an onset date is uncertain, preserve that uncertainty rather than silently substituting the submission date.
The useful question is which feature of the record a conclusion actually follows. A statement about entries received during a period does not, by itself, establish when experiences began. Conversely, a recalled beginning does not establish how continuously someone was observed afterward. The fictional log makes these distinctions visible before any calculation: define the event, choose the relevant clock, and identify what was recorded between observations.
Ask what an event-defined group remembers
Primary subgroups used any self-reported nausea, vomiting or diarrhoea.[1]
Imagine two fictional people, A and B, followed for the same observation period. A records one brief episode. B records several separated episodes, with gaps between them. A rule that asks only whether any episode occurred assigns both people the same positive value. That classification is internally consistent. It has deliberately discarded the number of episodes, their duration and their positions within the period.
Now suppose the question changes from whether an episode ever occurred to whether it interrupted activities repeatedly. The original binary values cannot answer that question. No algebra can recover B's recurrence pattern from a single positive marker, because A's different history produced that same marker. The problem is lost information, not necessarily incorrect classification. The appropriate representation depends on the question: an episode log, a duration total and an ever-event indicator each retain different features.
In the hypothetical comparison, it would also matter whether A and B had equal opportunities to make entries. An empty record over an incompletely observed period cannot simply be treated as a fully observed period with no episodes. A useful table would keep observation completeness separate from the event indicator, allowing readers to distinguish those situations. For a different reading exercise, the six-month review guide offers another place to ask what a summary preserves. Its narrative does not supply missing observations for this fictional example.
Give every reporting interval its actual width
Interval width changes the opportunity for a count to accumulate. A longer bar on a diagram can describe a longer reporting window without describing a larger number of people or a stronger response. Before comparing totals across windows, identify the quantity that the horizontal scale measures. Duration of observation and frequency of events require different calculations, even when both can be displayed with bars.
Consider an explicitly hypothetical example: four first reports arrive within two weeks, while six arrive within six weeks. Comparing totals alone ranks the longer interval higher. Dividing each count by its interval width gives two reports per week in the shorter interval and one per week in the longer interval. The ranking reverses. This calculation shows why unequal observation windows can alter a comparison; it does not reveal how many people were eligible to contribute during either period.
Counts per calendar week are still not rates per unit of participant observation time. Suppose, within this same fictional exercise, that many more people were under observation during the longer interval. The time contributed by eligible people would then differ for reasons beyond interval width. An incidence-rate calculation would need that accumulated eligible time, along with a defined event and entry and exit rules. Simple division by calendar weeks cannot supply it. Equally, a count averaged across a wide interval cannot locate a concentration within that interval. Recovering the timing would require the underlying report dates, rather than another decimal place on the average.
Look at the width of the interval
Scroll inside the chart to see its full width. With the chart focused, use the left and right arrow keys.
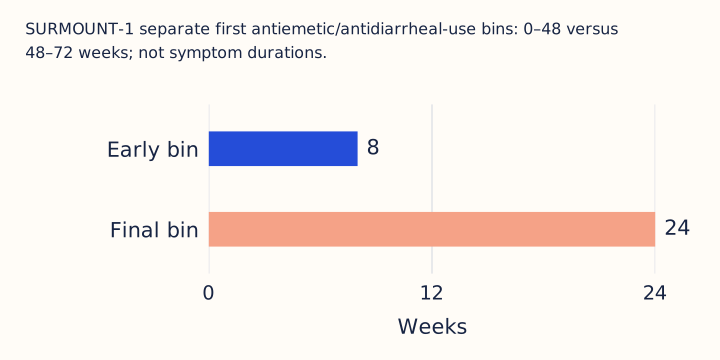
View the chart data
| Interval | Weeks |
|---|---|
| Early bin | 8 |
| Final bin | 24 |
Update the risk set after the first report
Start with a hypothetical group of twelve people, none of whom has yet made the report being counted. Three make their first report during an initial interval. If nobody enters or leaves observation for another reason, nine remain eligible to contribute a first report in the next interval. If three of those nine then report, the conditional proportion is three of nine. Using three of twelve would answer a different question about the original roster.
The previously counted people have not ceased to matter. They have ceased to be eligible for this particular first-report outcome. Their later entries could inform a recurrence question, while their continued observation could inform other outcomes. In the invented example, retaining them in the denominator of a first-report calculation would mix people who can still experience that defined event with people who already have. The denominator must follow the event definition.
Now allow someone to enter the fictional log later or stop providing records earlier. Eligibility must be updated at those times too; a roster total cannot substitute for the time each person contributes. If the recorded event were first use of an aid, repeated uses would require a separate count, and days of use would require another measure. Neither quantity could establish the occurrence or duration of the experience prompting use without that experience being recorded separately. These distinctions specify what information a log contains; they do not establish whether an aid changes an outcome.
Keep group membership separate from random assignment
Imagine an experiment in which treatment A is assigned at the beginning, a report B may occur later, and measurement C is recorded afterward. A could influence both B and C. Also imagine an unmeasured characteristic U that influences whether someone makes B and their later value of C. This is a hypothetical causal structure, not a claim that these particular relationships have been demonstrated.
Random assignment of A would not randomly assign B. If the analyst rearranges people into groups according to B, membership now depends on events after the original assignment. The groups could differ in U even if the original treatment groups were balanced with respect to it. Comparing their later measurements would describe a difference between selected groups. It would not, without further assumptions or design, identify what changing B would have done to C.
The distinction can be expressed as two questions. What values of C appeared among people who reported B? What values would those same people have had if B had been changed while other relevant influences were held appropriately comparable? The first concerns an observed grouping; the second concerns a causal contrast. In the fictional experiment, recording U might help investigate an alternative explanation, but merely adjusting a model for whatever happens to be available does not guarantee identification. An analyst would need to explain why the chosen variables address the proposed causal structure, including whether they occur before or after the event being studied.
Separate an endpoint average from a common trajectory
Consider two invented pairs of changes measured in arbitrary units. One pair is minus two and minus ten; the other is minus six and minus six. Both average minus six. In the first pair, neither individual has the average change. In the second, both do. The mean therefore leaves an important distinction unresolved even in this very small example: identical averages can accompany different distributions of individual values.
Add an earlier visit to the fictional records. One person's final change could follow steady movement, while another's could follow a larger movement and partial reversal. An endpoint average does not specify either path. Even an earlier average would leave several individual trajectories possible unless the measurements could be linked within people. Keeping that linkage allows a different question: whether the same people account for the changes at successive visits.
Model-based and raw averages also require different descriptions. A raw mean summarizes the included observations with the stated weights. A model-based mean may instead describe a defined combination of predictors under a particular fitted model. In a hypothetical analysis, the author should identify which quantity is presented and which observations and assumptions support it. Greater precision in estimating a group average would not erase variation between individuals. A narrow uncertainty interval for that average, if available, would answer an estimation question; it would not automatically become a narrow interval for one person's future change. The object being estimated must be named before its precision can be interpreted.
Follow the records that leave the comparison
Weight analyses excluded observations after treatment discontinuation.[1]
Build a fictional record system in which people with an unfavorable preceding measurement are more likely to stop submitting later measurements. Those who continue might then have more favorable subsequent values, even if nobody's underlying course has improved. The later observed mean combines the values recorded with the rule determining whose values remain visible. It cannot separate those contributions on its own.
In this imagined system, keeping every person's name on the original roster would not restore the absent outcomes. A roster establishes membership, whereas a completed measurement establishes a value under specified conditions. The distinction matters when defining the question. An average among people still providing records and an average among everyone who started are different quantities. Treating the former as the latter would require an argument about the missing values, not just a larger denominator printed beside the result.
One possible investigation of the fictional data would compare the preceding histories of continuing and departing reporters. That could reveal differences already present before records disappear. It would not reveal the later unmeasured outcomes themselves. Different assumptions about those outcomes could be explored as separate scenarios, with the assumptions shown explicitly. Agreement across scenarios would be informative only within the range of assumptions examined. A conclusion that survives modest changes but fails under another plausible scenario should be described as conditional. The scientific gain comes from locating the assumption that changes the answer, rather than presenting an observed mean as if observation had been complete.
Write down an alternative explanation before choosing one
Imagine a fictional setting in which people decide whether to seek an aid after different experiences. Some seek it after repeated difficulty; others do not seek it because their experience has been brief or has already changed. If the groups have different subsequent measurements, the contrast combines their starting differences, the timing of their decisions and any possible effect of the aid. The decision itself was not detached from the reason for making it.
This is the logic of confounding by indication: the circumstances prompting a choice can also be associated with the outcome used to judge that choice. In the hypothetical setting, a worse subsequent value among aid users would not prove harm, because their preceding experience could already differ. A better value would not prove benefit either. It could coincide with a change that would have occurred without the choice. Neither possibility establishes what actually happened.
A useful analysis of the invented records would define a common starting point for comparison and retain the histories leading to each decision. It would then specify the alternative explanations that the available observations can address and those they cannot. Related reading in the stopping-treatment discussion offers another setting in which questions about changing exposure and continuing observation can be kept separate. That link contributes no comparison group to this exercise. The worked problem remains one of causal interpretation, with no conclusion about the effectiveness of any medicine, food or supplement.
Specify an analysis another reader could reproduce
Lilly funded the analysis; six authors were employee-shareholders.[1]
Consider a hypothetical audit of the observation log developed here. Before viewing comparative results, write down the event definition, the rules for entering and leaving observation, and the dates used to place reports into intervals. Preserve the original dates so another analyst can reconstruct the grouping. Retain a record of exclusions with their reasons. A final table alone would not allow those decisions to be checked.
The audit could then compare the original interval arrangement with equal-width intervals chosen under a stated rule. This would test whether the apparent timing pattern depends on grouping boundaries. It should also distinguish changes in aggregate averages from changes linked within individuals. Specify in advance what would alter the interpretation: for example, a claimed concentration that disappears when boundaries move, or a group difference that changes materially under stated missing-observation scenarios. These are proposed checks on fictional data, not completed analyses.
Transparency about interests gives readers a reason to inspect analytical choices; it does not identify a mathematical error by itself. A reproducible account should make the important choices inspectable regardless of who funded the work. For the related issue of which records qualify for a comparison, see the companion observation analysis. The proposed audit would succeed by making disagreement specific: another reader could locate the definition, exclusion or assumption responsible for a changed conclusion, instead of accepting or rejecting a result solely on the identity of its sponsor.
Keep a reporting interval out of a care plan
Zepbound is not recommended in severe gastroparesis; gastrointestinal reactions can be severe.[2]
Known serious hypersensitivity to tirzepatide or its excipients contraindicates Zepbound.[2]
These are selected label statements, not a complete account of product safety. For a separate reading entry, see the molecule reference. The analytical exercises here address the interpretation of records and comparisons; they do not determine what an individual should do.
A reporting interval is a choice about how observations are grouped. It is not a threshold at which a person's experience becomes acceptable or a schedule for responding to it. Likewise, an endpoint is a chosen moment for summarizing a measurement, not a deadline for an individual's course. Keep those meanings separate when moving from a research display to a conversation about care. A useful reading question concerns what was measured and what remains unknown; it cannot substitute for an individual clinical decision.
Putting the evidence together
The most informative conclusion from a temporal comparison is one tied to a clearly defined quantity. A claim about frequency needs an event definition and corresponding risk time. A claim about a path needs linked observations across that path. A causal claim needs an account of why the comparison separates the proposed influence from alternatives. These requirements suggest a practical way to strengthen an analysis: identify the missing element that prevents the desired inference, then ask what observation would supply it. In the fictional examples, retaining exact dates could resolve uncertainty created by interval grouping, while collecting later measurements could address a different uncertainty created by departures. Neither improvement would automatically answer the other question. My assessment is that a comparison becomes more useful when its remaining uncertainty can be located in a specific definition, missing record or assumption that another analyst could examine.
Questions and answers
Does a larger interval count mean events were more frequent?
A larger count can reflect a wider reporting window, more eligible people, more observation time, or some combination. In the fictional interval exercise, dividing by calendar width changed the ranking but did not produce a participant-time rate. To answer a frequency question, define the event and identify the denominator that corresponds to the comparison.
Does an event-defined group represent one common experience?
No. In the hypothetical A and B example, the same positive indicator represents different histories. Membership says that a definition was met; it need not preserve recurrence, duration or timing. A question about those features needs the underlying records and comparable observation opportunities, rather than a stronger interpretation of the binary label.
What is missing when follow-up ends after treatment stops?
The absent outcomes remain unknown, along with how their inclusion would change the summary. In the fictional reporting system, earlier records can help examine why observation ended but cannot supply later values. Continued measurements would address a different gap from merely retaining names on a roster. Any assumption used instead should remain explicit.
Scope and limits
The worked records and numerical examples are fictional teaching devices. They do not reproduce participant data or estimate individual outcomes. This analysis cannot establish the causal effects of reporting an event, choosing an aid or changing treatment. Its questions concern what a defined set of observations can support.
Sources to open
- Rubino (2025) — Wiley; checked
- ZEPBOUND — NLM; checked